Prof defines America in 100 charts

You can learn a lot about an author from what s/he [I don’t like “they” when gender is uncertain] thinks is important enough to include on the back cover of a book.
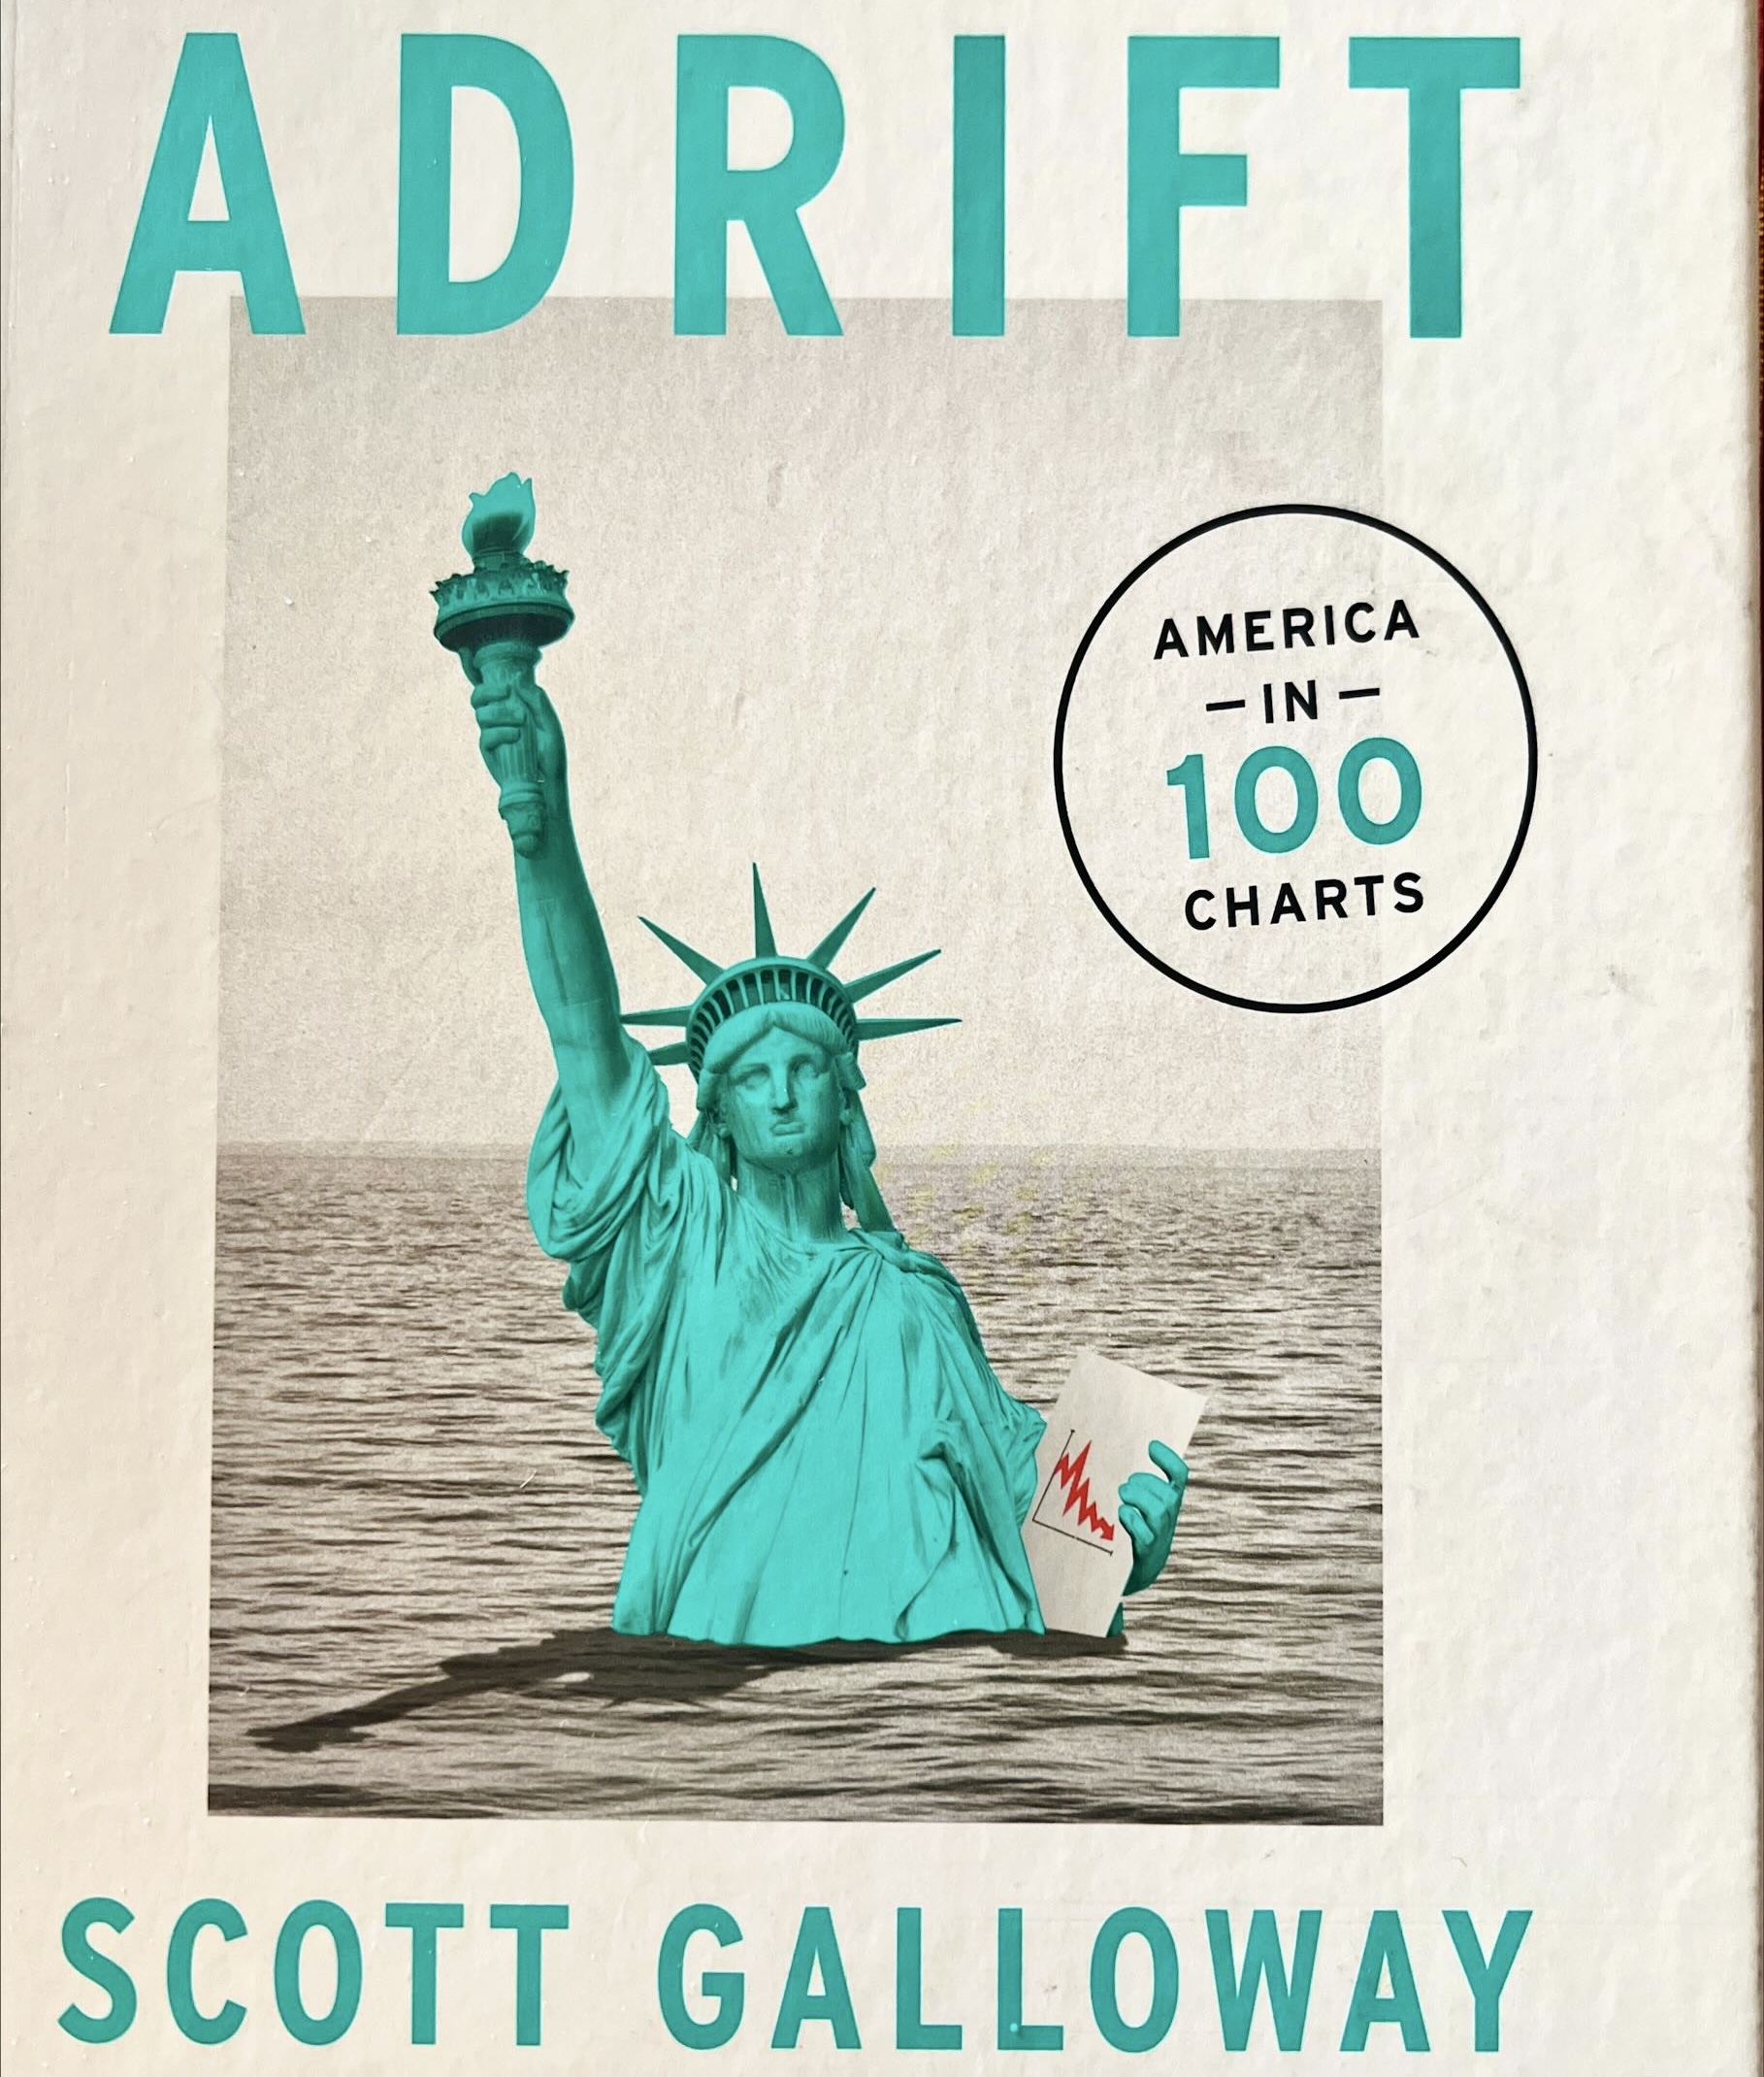
Here’s a couple of quotes from Scott Galloway’s “Adrift: America in 100 charts”:
“A business world rock star” — Michael Smerconish
“Gordon Gekko with a social conscience” — British GQ
“Insufferable numbskull” — Elon Musk
The book is published by Portfolio/Penguin, $35 hardcover.
A professor of marketing at NYU Stern School of Business, Galloway obviously has a healthy ego, and healthier sense of humor.
I first saw him on Smerconish’s Saturday-morning CNN show and was hooked by his out-of-the-box thinking, passion, and entertaining delivery.
One Galloway fresh idea was to paint a “portrait” of an America he sees as adrift through 100 charts and graphs, each supported by a brief explanatory editorial. The book is easy to read and digest, and inadvertently reveals that Galloway is a bit at war with himself — a composite of capitalism and populism.
He is a self-made multi-millionaire, having started nine companies (at last count), in addition to his teaching chores.
By his own admission, (he calls it a humble brag) he has gone from being raised by a single immigrant mother to a man who buzzes around the world on private jets. He feels no guilt about his wealth, other than feeling more people should have access to becoming rich, and sees that door is slowly closing in America.
He complains that public corporations strain to maximize profits, but isn’t that what shareholders want? In fact, he admits later in the book, that when he was a shareholder in Twitter, he complained to the board about “weak shareholder returns.”
He acknowledges the economy exploded under Republican Ronald Reagan, who tripled the debt, to about $2.7 trillion. It reached $31 trillion under Democrat Joe Biden. Under Reagan, the debt was 32% of GNP. It is 120% of GNP today. We are spending far more than we are taking it.
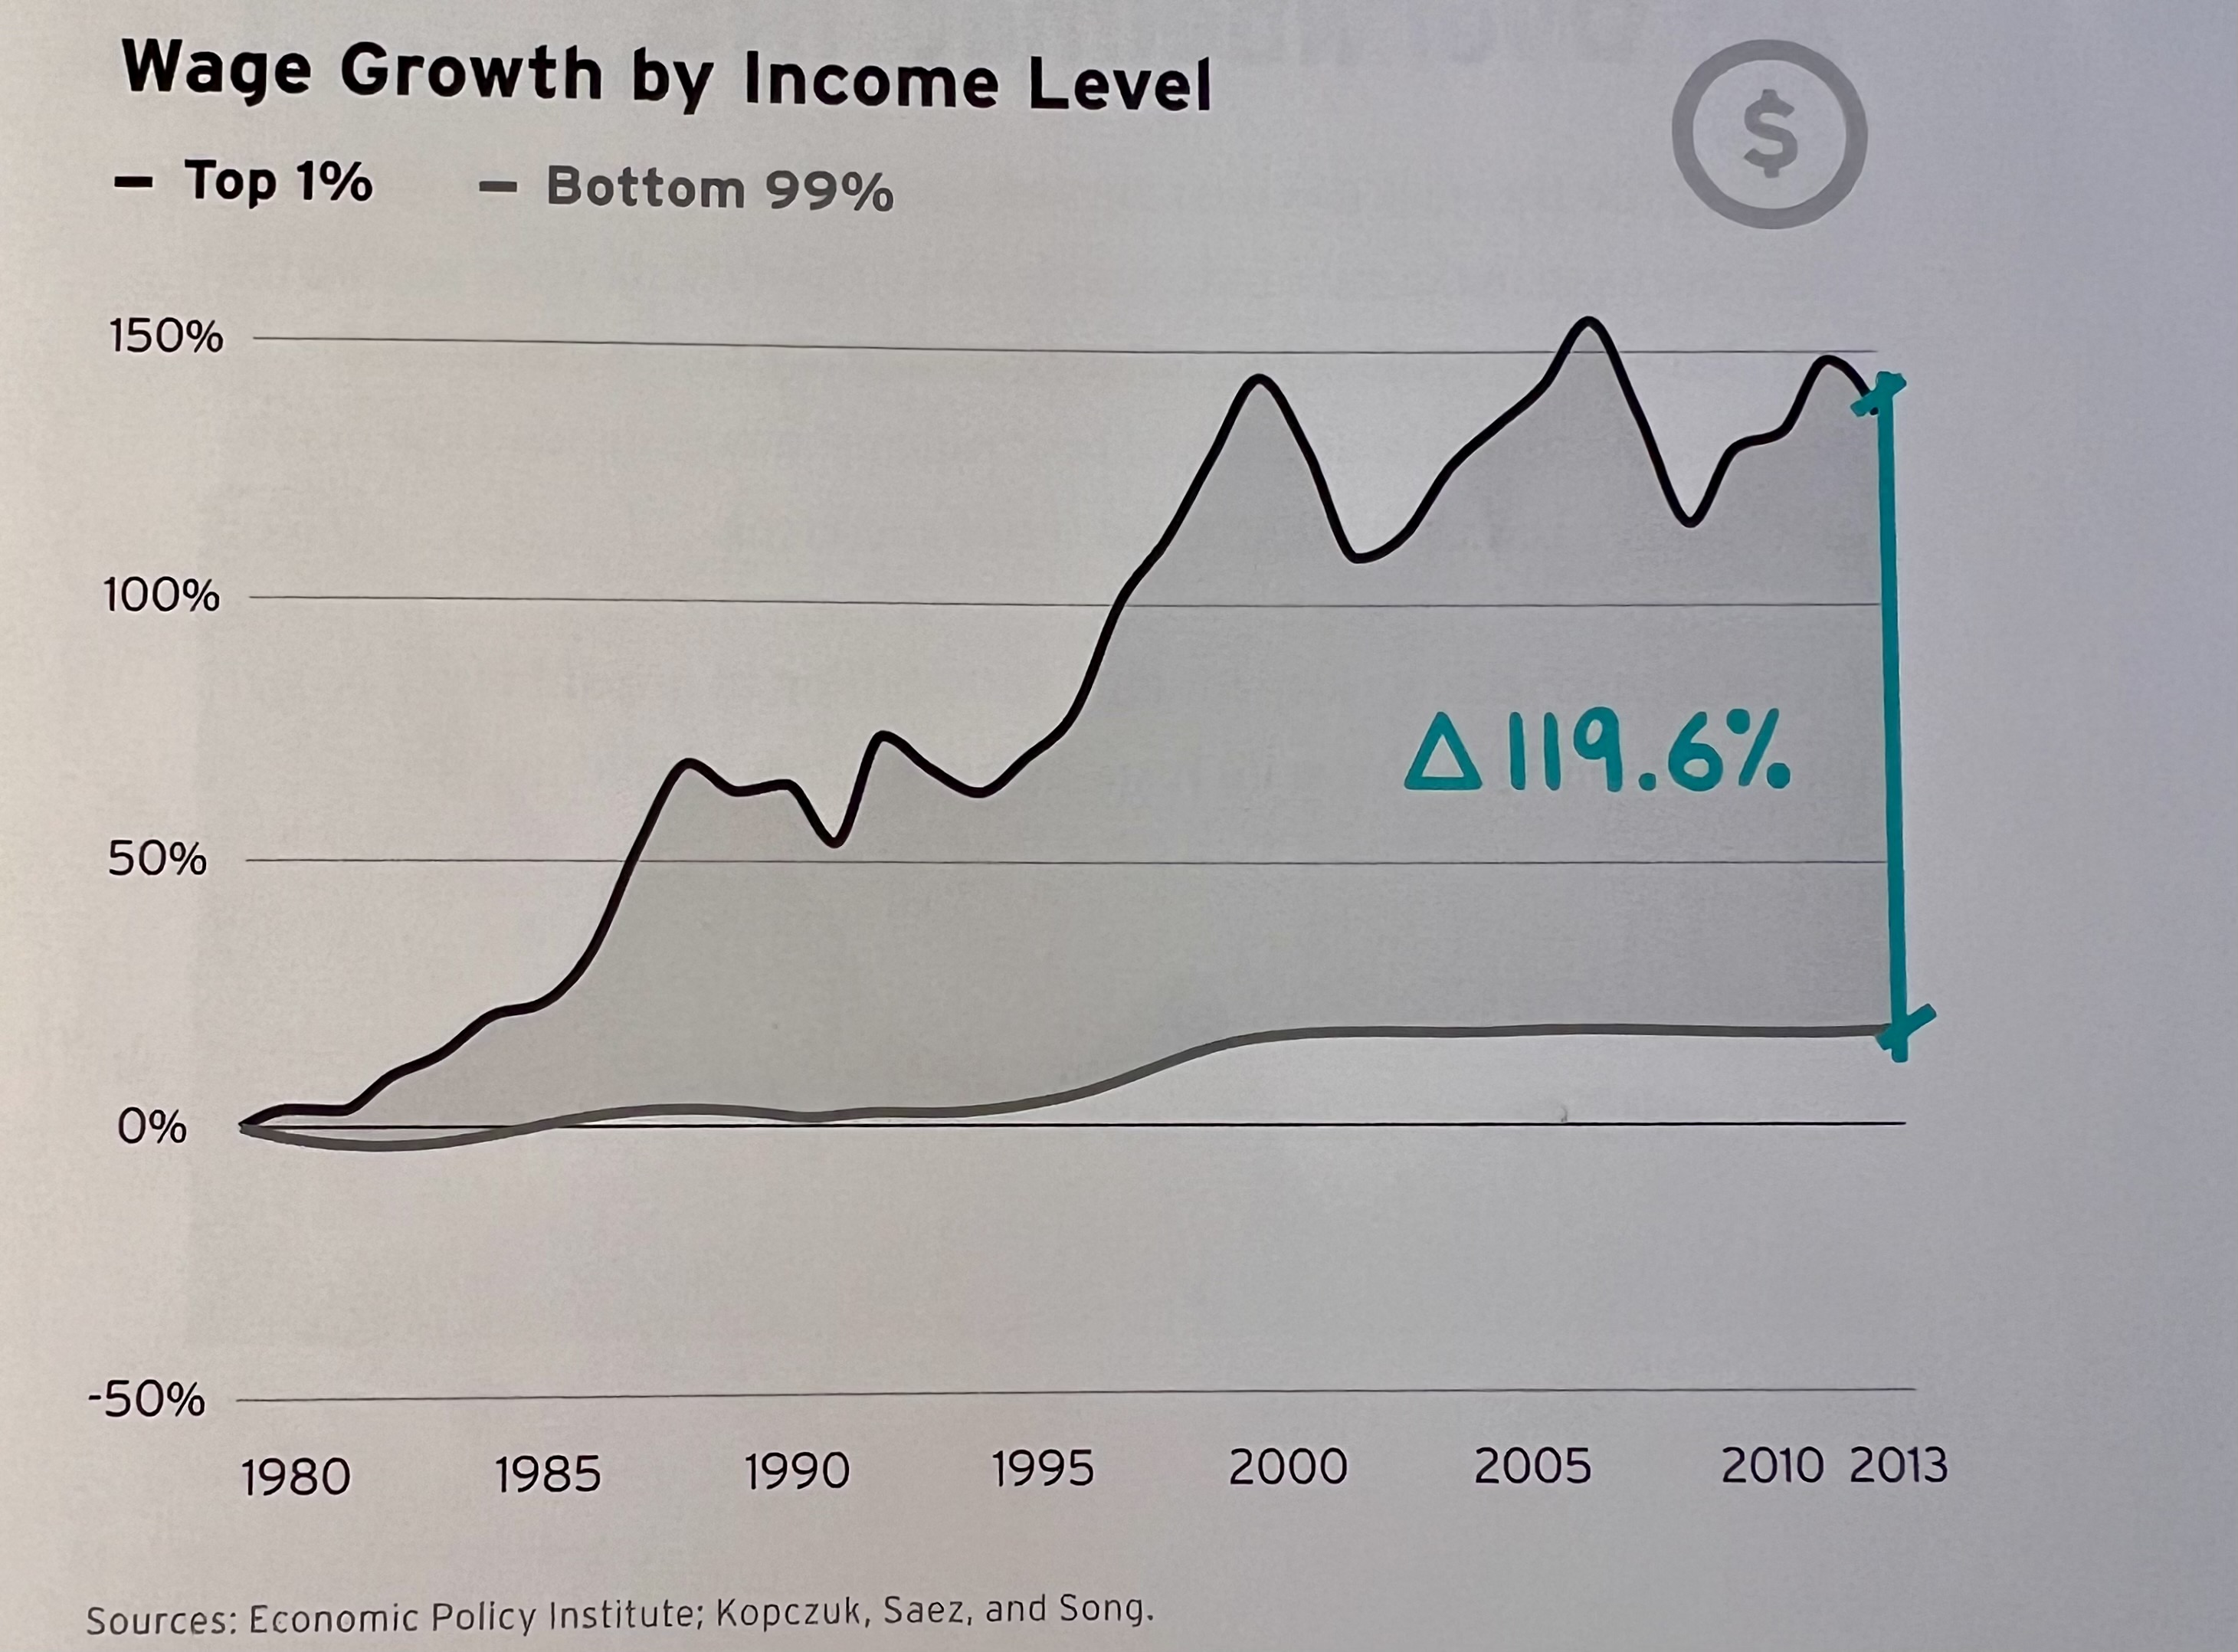
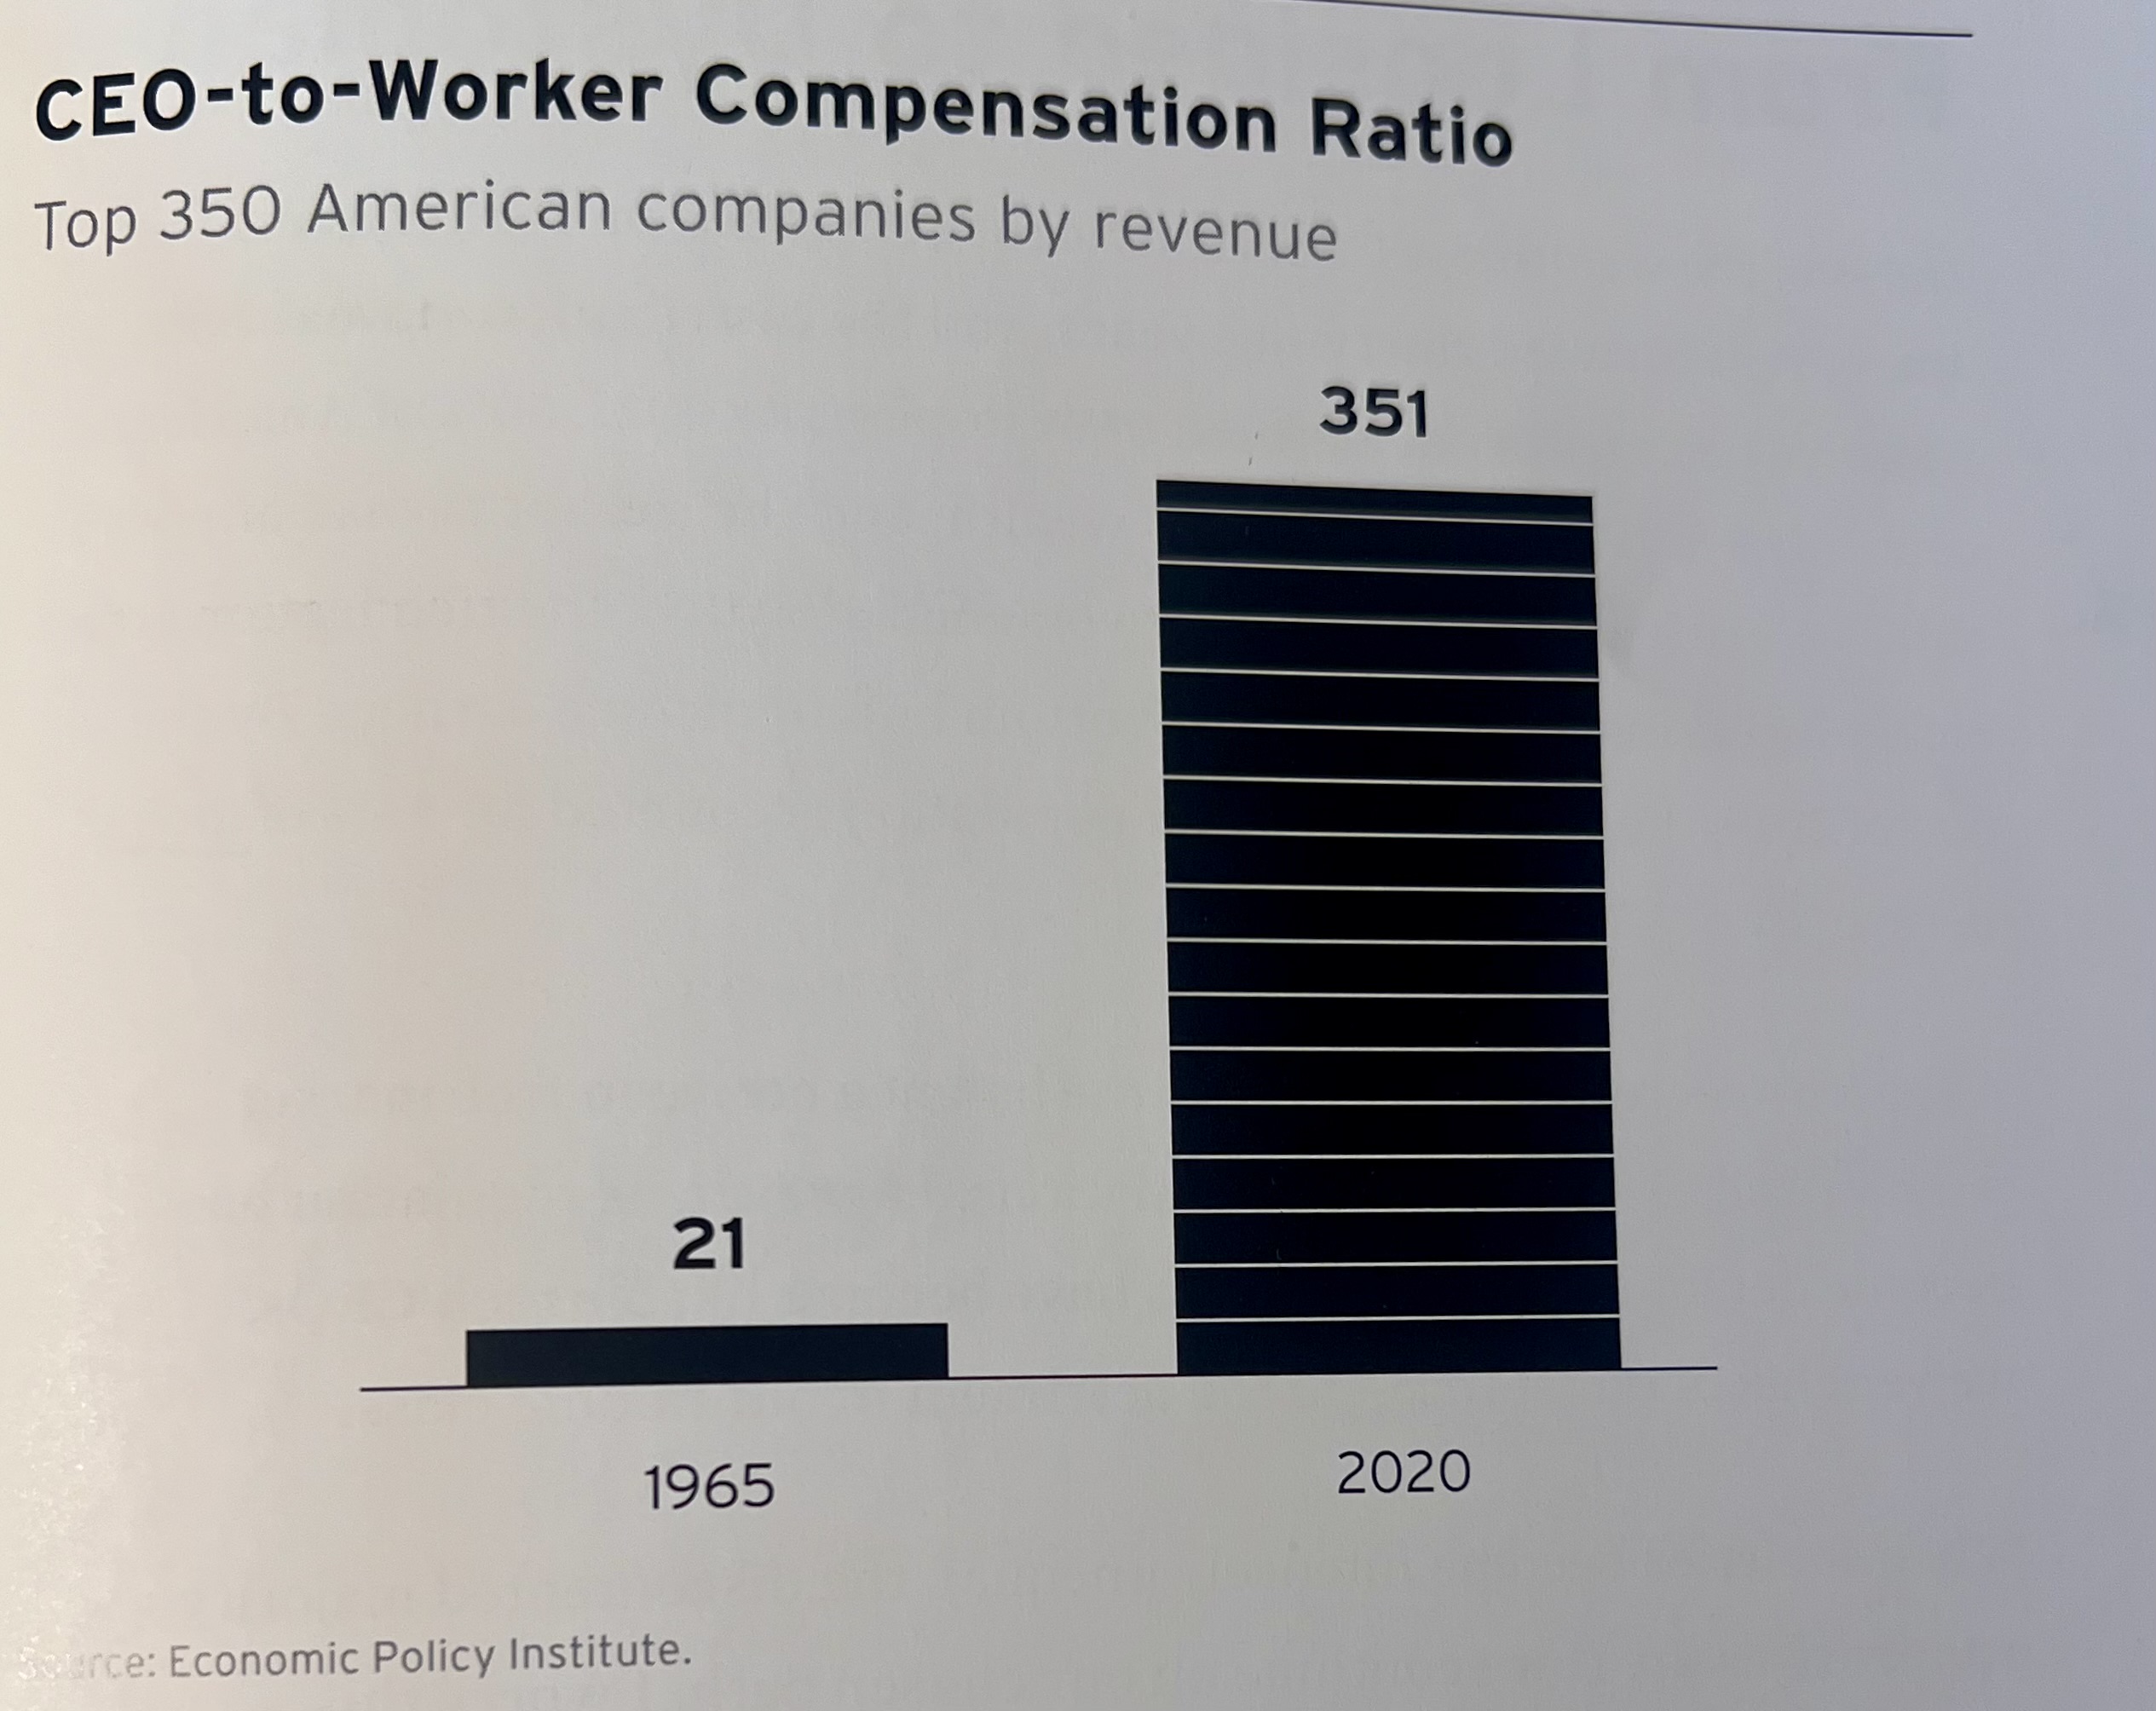
Galloway has several charts showing the unequal distribution of wealth, but offered no solution until late in the book, when he proposed a one-time “wealth tax” — of 2% on the top 5% of wealthiest Americans. He says that would raise “up to” $1 trillion.
Note to Galloway: With the national debt at $31 trillion, that ain’t enough. It would barely move the needle. (American wealth is estimated at $138 trillion.)
He feels America is at a crossroads and he is uncertain if we will take the right path, while conceding our imperfect country usually has in the past.
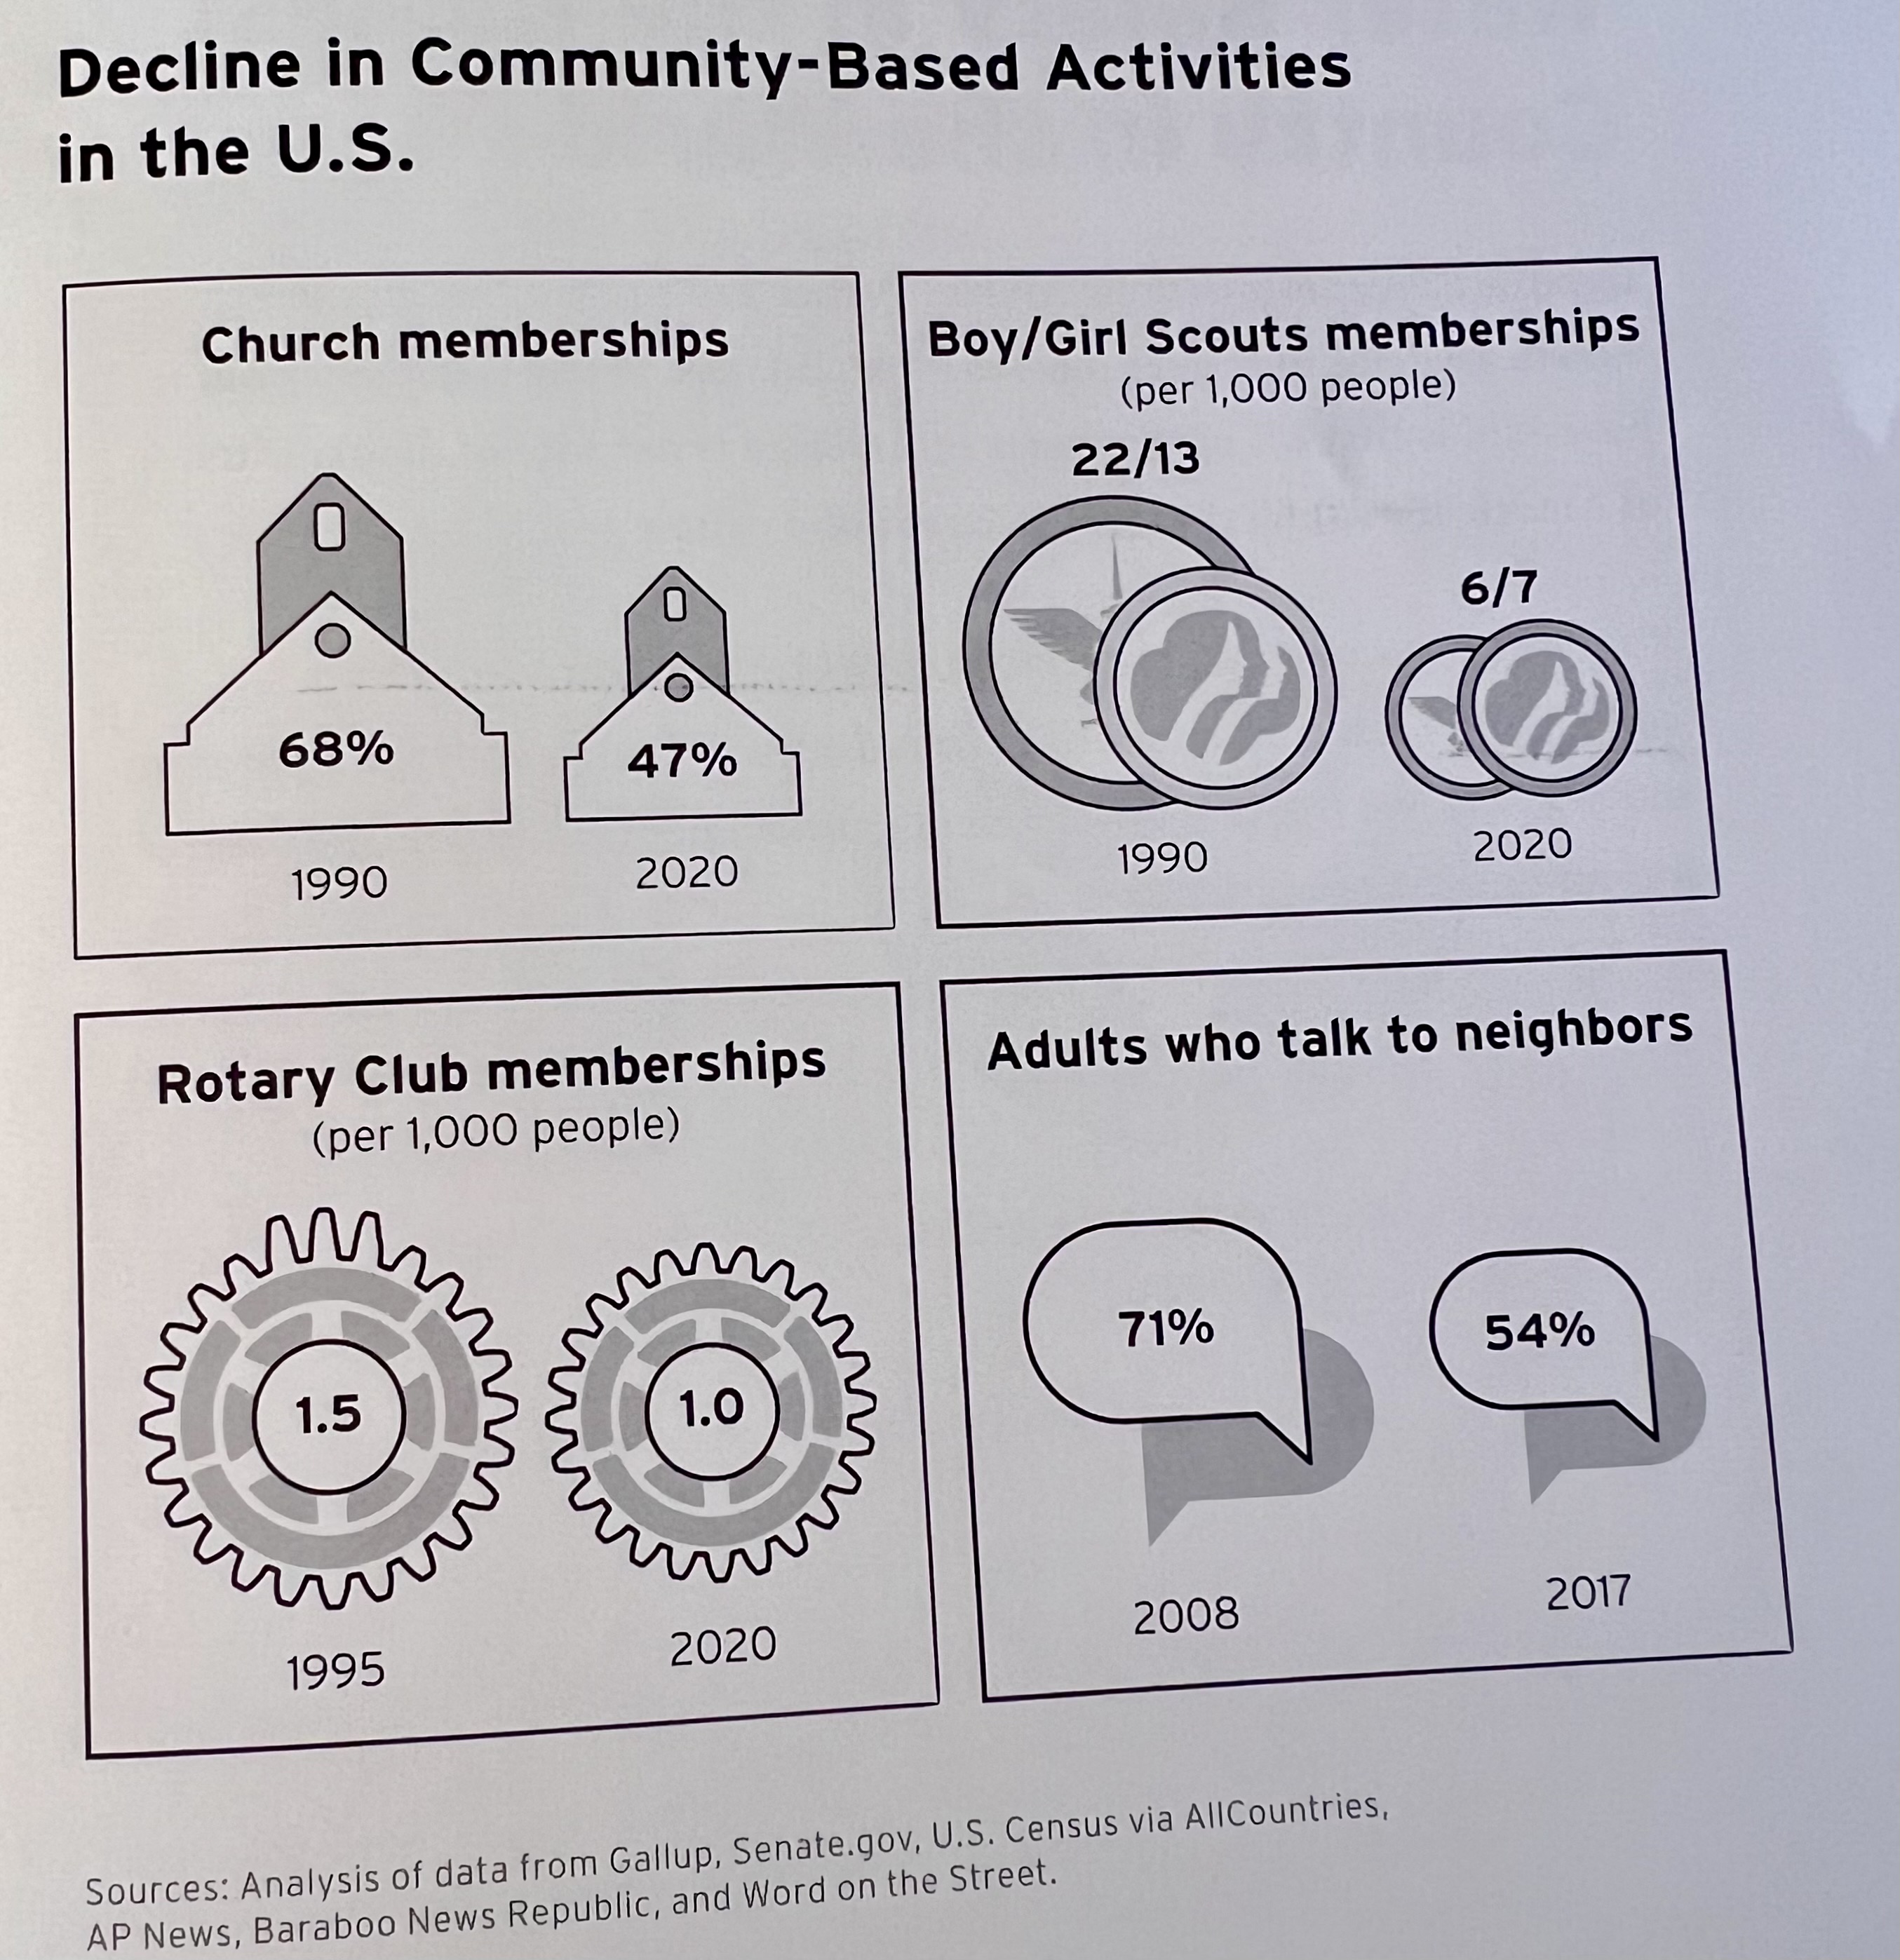
The charts show that we are spending less on important things — like research and development — than in the past, and that wealth is increasingly unfairly divided, that Americans are more materially rich, yet spiritually poor, with our youth becoming increasingly lonely, and suicidal.
He sees us floundering in a sea of partisanship, corruption, and selfishness, and believes a strong middle class is one of the cures.
And yet he cites tax write-offs on mortgage interest as unfair, when they are a great benefit to the middle class. He also harbors the strange notion that the elderly are stealing from the young, as if the generation who built America are not entitled to reap some benefits.
The charts show both hope and despair, although Galloway remains at heart an optimist.
“The world is significantly wealthier, freer, healthier, and better educated than it was 40 years ago,” he writes.
I’d call his views liberal, and sometimes the targets of his wrath indirectly include himself.
When he writes that “Marginalized voices and an entrenched white patriarchy seem to be preparing for war, rather than seeking common ground,” I have to ask Galloway, aren’t you an entrenched white patriarch?
[Spoiler alert: Yes, he is, but one with a social conscience.]
The goal of a good author is to persuade, but at least to make the reader think.
Galloway does that, for me and others.
To do that for you, I am presenting six thought-provoking charts, out of Galloway’s 100