Uncategorized

Charting a course on police

There is no hidden agenda in these two charts, from the accurate and nonpartisan USAFacts.
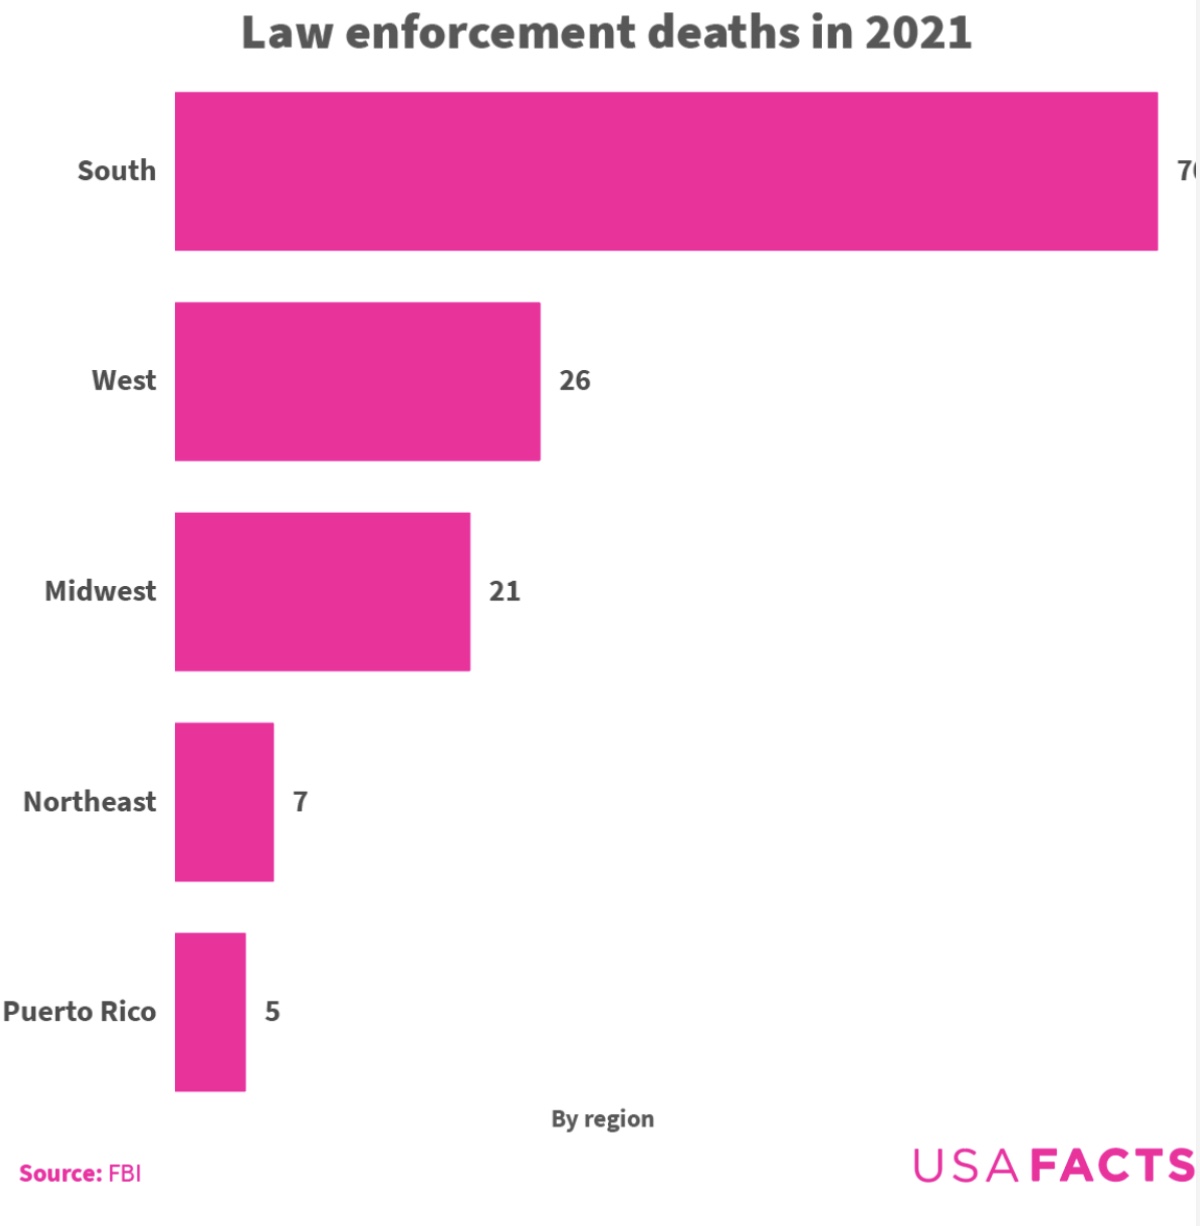
We start with the display of law enforcement killed on-duty last year, by region. How does yours do?

Facts are Facts

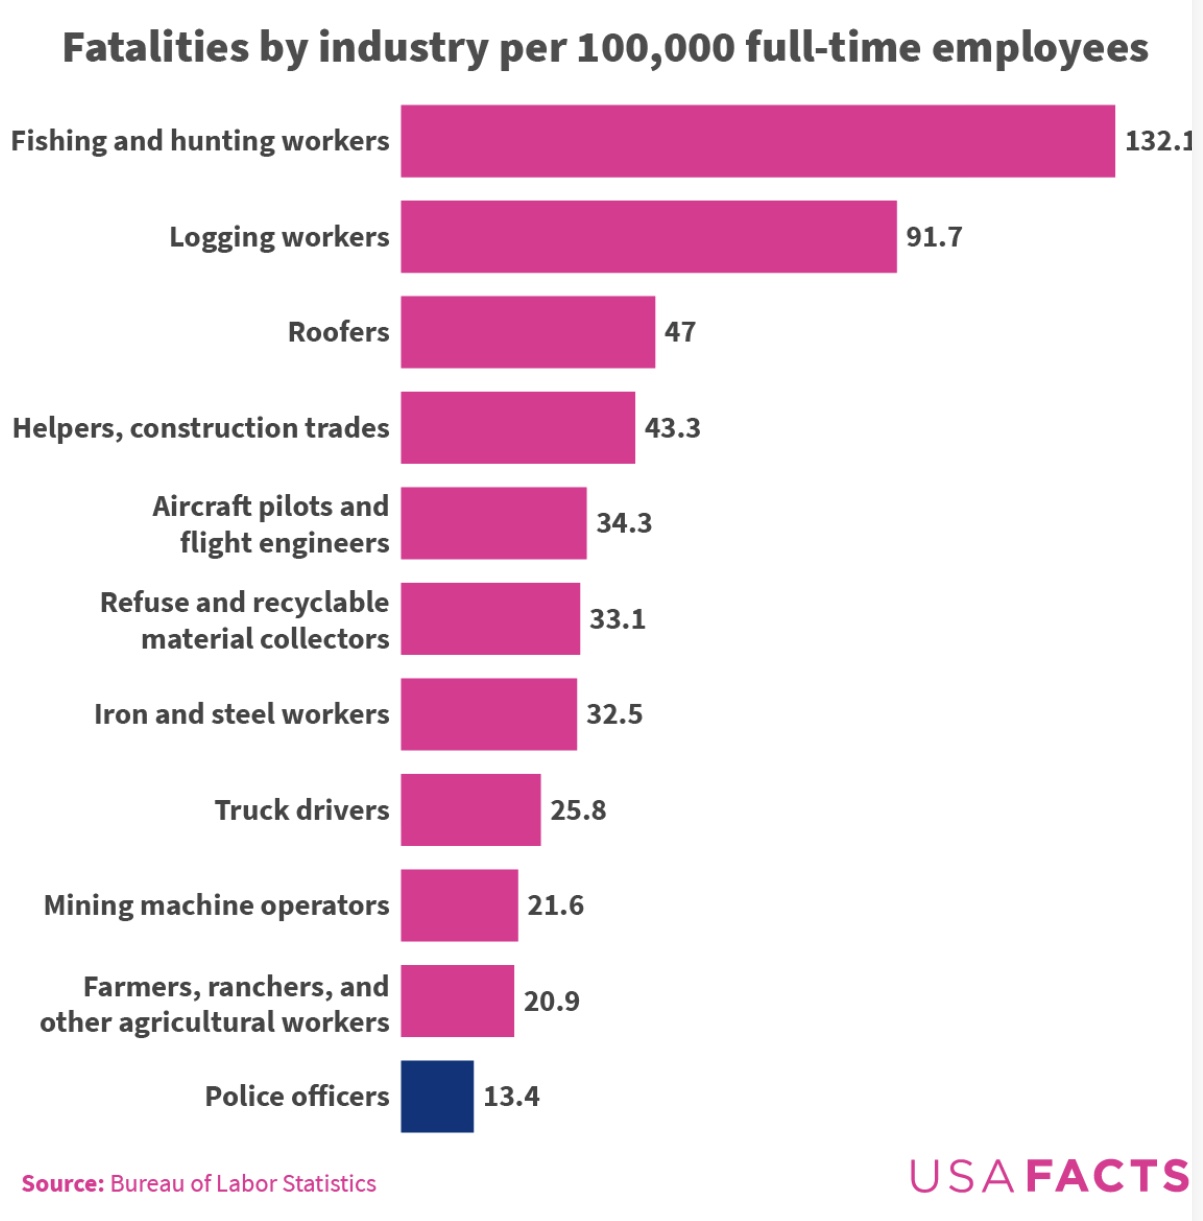
It is then followed by this chart, which shows many occupations are far more deadly than police work. But you have to understand most blue collar deaths come from on-the-job accidents, while most blue uniform deaths are intentional.

Stu Bykofsky

Recent Posts

Is Philadelphia a “Black city”?

This column was written three years ago, following the Philadelphia Inquirer’s journey into discovering its…

6 hours ago

Americans awake to the reality of President Trump

The Trump honeymoon is over. The numbers aren’t great for President Trump (Photo: NBC News)…

1 day ago

Scorecard: The first 4 weeks of Trump II

There hasn’t been such an activist rookie* President since Franklin D. Roosevelt. The Odd Couple:…

3 days ago

Should trans people get equal rights to gays in Philly?

Philadelphia should be an LGBTQ sanctuary city. Illustration created by ChatGBT That was the interesting…

5 days ago

Unfair criticism and what Trump needs to learn

“Starting on day one, we will end inflation and make America affordable again, to bring…

1 week ago

Cry baby Dems need to pick their fights with whirlwind Trump

Wrecking ball, bull in a China shop, disrupter, Constitution-buster — choose your own metaphor. Just…

2 weeks ago